Procurement analysis case study
Summary
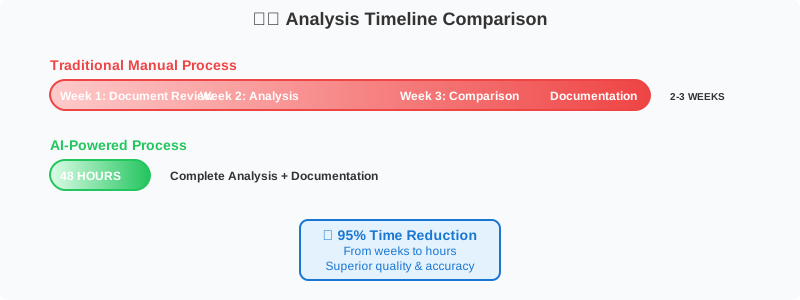
A sports venue operator had to choose between four international catering suppliers. The contract affects £15 to 18 million of annual revenue. Each proposal ran to more than 300 pages, and the board needed a decision within 14 days. The finance director used an AI-assisted process to compare the four proposals in 48 hours. A manual comparison would have taken 2 to 3 weeks. The analysis found a staffing assumption in one proposal that hid more than £200K a year in cost.
Results
| Metric | Manual | AI-assisted | Change |
|---|---|---|---|
| Analysis time | 2 to 3 weeks | 48 hours | 95% less |
| Hidden cost found | Not shown in the proposal | £200K+ a year | Found before negotiation |
| Output | Summary notes | 15-slide board presentation, 25-page financial analysis, footnoted sources | Board-ready |
The problem
Business context
Decision parameters:
- Industry: sports venue operations
- Contract value: £15 to 18 million annual revenue
- Proposals: 4 international suppliers, 300 or more pages each
- Deadline: executive decision within 14 days
- Staff: one finance director, with other projects in progress
Document formats
The four proposals arrived as Excel workbooks with linked formulas, PDFs with embedded tables, and Word documents with mixed data. The suppliers used different cost categories, so there was no common baseline to compare them on.
Limits of a manual review
| Problem | Effect | Risk |
|---|---|---|
| Time | 40 or more hours of manual work | Critical |
| Errors | Calculation mistakes in complex models | Critical |
| Consistency | Each proposal read and judged on its own terms | High |
| Context | No industry benchmark to test the projections against | High |
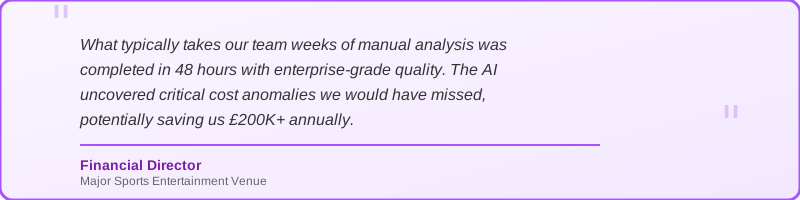
Client comment
Method
Three phases
Phase 1: context, 30 minutes
Research gathered:
- Stadium catering operations
- Industry benchmarks for growth and food cost
- Post-pandemic market conditions
- The client's own objectives for the contract
Phase 2: document processing, 45 minutes
Processing by format:
| Input | Method | Output |
|---|---|---|
| Excel files | Formulas kept and recalculated | Financial models on one template |
| PDF documents | Table structure recognised | Structured data |
| Word documents | Financial figures parsed from prose | Cost structures on one template |
| Each format | Mapped to one set of cost categories | Common comparison baseline |
Phase 3: comparison, 60 minutes
Three lenses:
Lens 1: base case
- Return at the current activity level
Lens 2: growth
- Revenue under each supplier's expansion scenario
Lens 3: risk
- Costs not stated in the proposal
- Contingency the client would need to hold
Checks and audit trail
- Source attribution: each figure carries a reference to the document it came from
- Audit trail: footnotes for each figure, so a reviewer can check it
- Review: the finance director reviewed each draft and corrected assumptions
- Iteration: the analysis ran again after each round of corrections
Deliverables
Decision documents
Board presentation
15 slides
Summary and recommendation
Side-by-side supplier comparison
3-year financial impact
Risks and how to handle them
Financial analysis
25 pages
Cost-benefit analysis
Revenue stream breakdowns
Labour cost structure comparison
Costs not stated in the proposals
Implementation plan
8 pages
Negotiation points
Due diligence checklist
Contract terms to change
Performance monitoring
Supporting documents
| Document | Purpose | Pages | Audience |
|---|---|---|---|
| Audit trail report | Source reference for each figure | 12 | Compliance and legal |
| Assumption register | Baseline assumptions and the reason for each | 6 | Finance team |
| Risk register | Likelihood and impact of each risk | 8 | Executive committee |
| Action plan | Next steps with dates and owners | 4 | Project management |
Findings
Three anomalies
Anomaly 1: staffing assumption
- One supplier proposed 40% fewer staff than the other three
- Its model assumed the client would supply the sales staff
- Effect: £200K or more a year in cost that the proposal did not show
Anomaly 2: growth projections
| Supplier | Projected growth | Industry benchmark | Assessment |
|---|---|---|---|
| Supplier A | 15% a year | 5 to 7% | Above benchmark |
| Supplier B | 8% a year | 5 to 7% | Near benchmark |
| Supplier C | 3% a year | 5 to 7% | Below benchmark |
| Supplier D | 12% a year | 5 to 7% | Above benchmark |
Anomaly 3: cost structures
- Food cost ranged from 28% to 35% of revenue across the four proposals
- Each supplier allocated labour cost in a different way
- Ranking the suppliers required mapping the four proposals to the same cost categories
Recommendations
Ranking by lens
Base case
Best: Supplier B
Highest return at current activity
Growth
Best: Supplier A
Most credible expansion plan
Risk
Best: Supplier C
Most conservative projections
Negotiation points
- One labour cost structure for each bidder
- Defined revenue growth milestones
- Performance penalty clauses
- Consequences for service level failures
Aim:
Contract terms that close the three anomalies above
Timeline: manual and AI-assisted
Business impact
Direct results
- Time: 40 or more hours of the finance director's time saved
- Decision basis: four proposals compared on one set of figures
- Cost: £200K or more a year in hidden cost found before negotiation
- Board: one document set that finance, legal, and the executive committee worked from
- Reuse: the framework applies to the client's next supplier review
Technical architecture
Processing stages
Industry Analysis] B --> F[Multi-Format Extraction
Data Standardization] C --> G[Scenario Analysis
Sensitivity Testing] D --> H[Professional Documents
Audit Trails] style A fill:#e3f2fd style B fill:#f3e5f5 style C fill:#e8f5e8 style D fill:#fff3e0
Security and confidentiality
- Anonymisation: supplier identities anonymised throughout
- Audit: each output figure traces to a source document
- Access: restricted by permission
- Retention: stored with backup and recovery in place
Conclusion
Four 300-page proposals in three file formats were compared in 48 hours against a 14-day deadline. The comparison found a staffing assumption worth £200K or more a year that the proposal did not show, and it gave the board a 15-slide presentation with a source footnote on each figure. The finance director reviewed each draft. The framework is ready for the client's next supplier review.